Interactive 3D Map of Traffic Data
I designed and developed an interactive, responsive 3D map of the state of Delaware, comparing traffic intersections with traffic accidents.
To create this, I integrated the geographic mapping library MapboxGL.js with the 3D library Three.js, plotting 3D "towers" to represent the data. Then, I imported GeoJSON data into Mapbox studio and exported two data layers to integrate with the app. To finish it off, I added a HTML/CSS user interface with buttons for easy customization, allowing the user to toggle satellite tiles, 3D buildings, and individual data points.
View the map at:
https://de-data-lab.github.io/map3d-ar/build-html/map_traffic.html
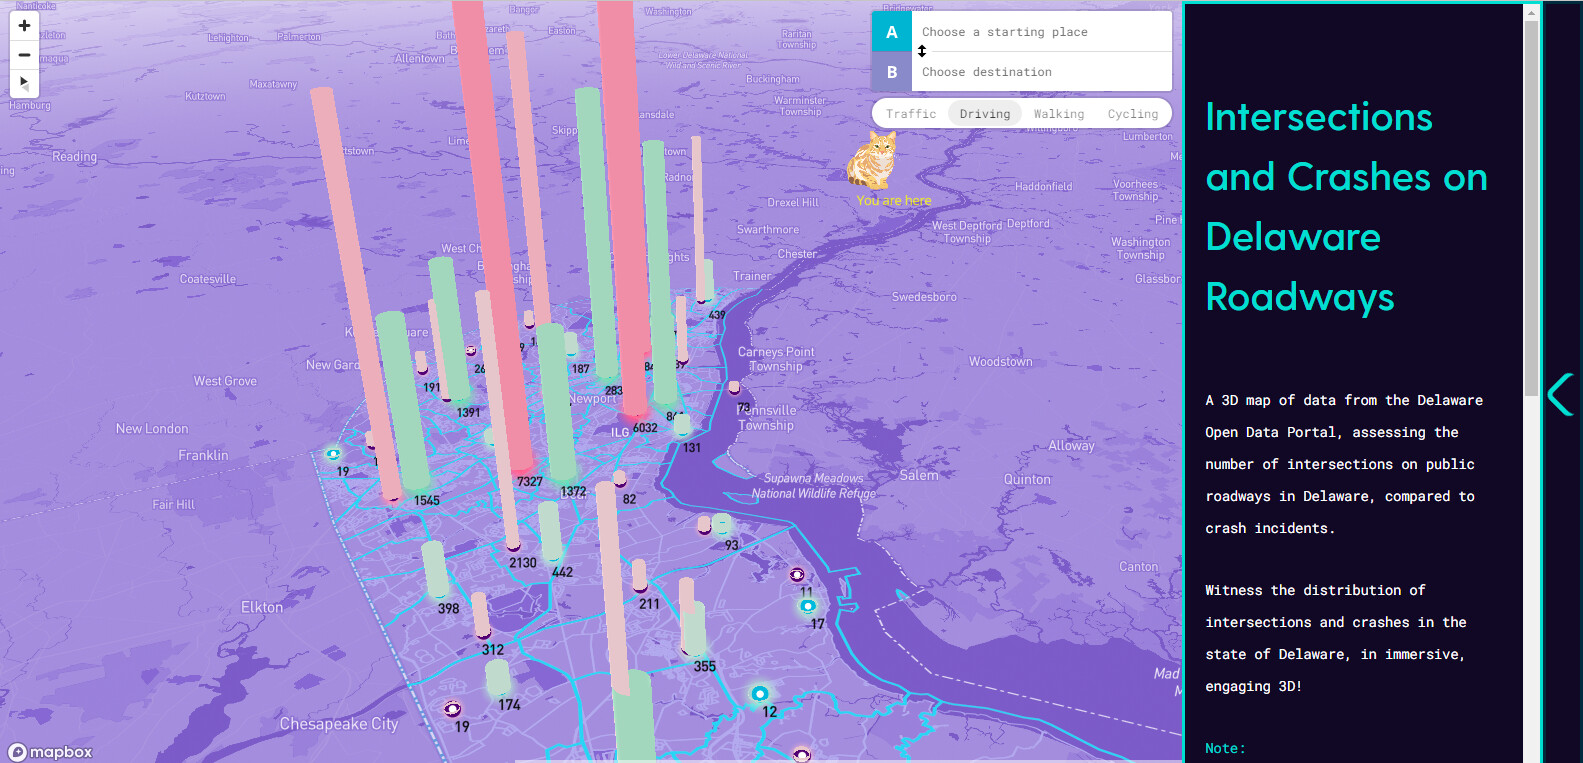
This map of Delaware compares data clusters of traffic intersections (green) and traffic accidents (pink) with helpful color-coding and the relative heights of the towers.


Satellite view


Data points when 3D towers have been toggled off

Map when 3D towers and data points have been toggled off

The map of Delaware, centered on the Wilmington Riverfront, with 3D buildings added for clarity